
Environmental Initiatives (E) Environmental Policy and Goals
Basic Policy
MJIA has established an environmental management framework, complies with environmental laws and regulations, and strives to conserve the environment by promoting environmental consideration and reducing environmental impact. Through these efforts, MJIA actively advances forward-looking efforts aimed at contributing to the realization of a sustainable society through its business activities.
MEL also endeavors to invest in energy-efficient properties with due consideration for environmental impact. In addition, it has established an environmental management system and will continue to implement environmental and energy-saving measures at its portfolio properties, as well as improve the efficiency of energy usage. Furthermore, it will regularly disclose information regarding environmental performance and related issues, and will continue to promote initiatives aimed at environmental consideration and the reduction of environmental impact.
KPI Trends
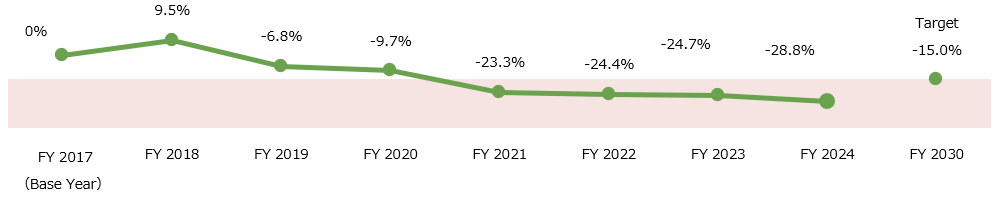
1. Energy
Reduce energy consumption intensity by 15% by FY2030 (FY2017 baseline)
This graph can be scrolled sideways.
2. GHG
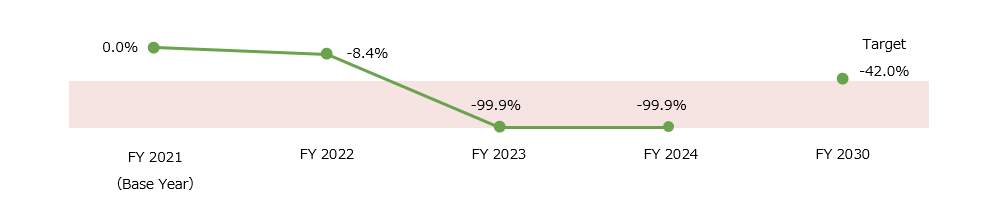
Achieve net zero GHG emissions (including the entire value chain) by FY2050SBTi
42% reduction in total GHG emissions by FY2030 (Scope 1 + 2) (FY2021 baseline)SBTi
This graph can be scrolled sideways.
3. Water Consumption
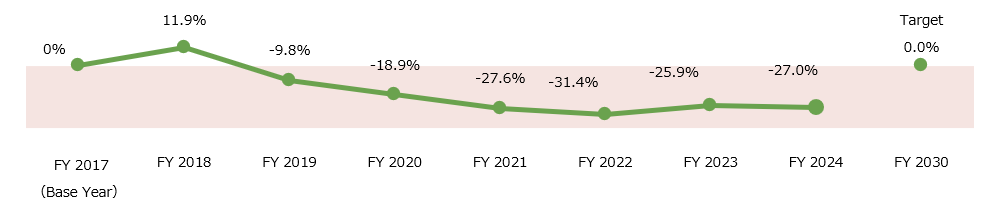
No increase in water consumption until FY2030 (FY2017 baseline)
This graph can be scrolled sideways.
4. Waste Management
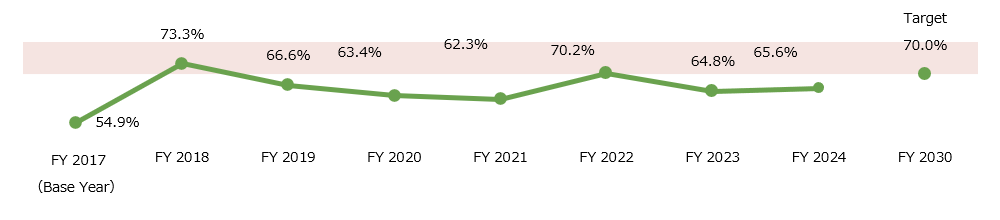
Recycling rate of 70% or more by FY2030.
This graph can be scrolled sideways.
5. Environmental Certification
Increasing Environmental Certification to 100% by FY 2030
For environmental certifications, please see below.
https://mel-reit.co.jp/ja/esg/external/greenbuilding.html
Environmental Performance Data
This table can be scrolled sideways.
Reduce energy consumption intensity by 15% by FY2030 (FY2017 baseline)
| Energy Consumption | Total energy consumption (MWh) |
Breakdown (MWh) | Data coverage (GFA basis) (Note 1) |
Energy consumption intensity (kWh/m2) (Note 2) |
Percentage change in intensity |
|
|---|---|---|---|---|---|---|
| Gas/fuel consumption |
Electricity consumption |
|||||
| FY2017 | 27,920 | 1,625 | 26,294 | 100% | 50.20 | - |
| FY2018 | 30,601 | 1,629 | 28,972 | 100% | 54.95 | 9.5% |
| FY2019 | 33,314 | 1,793 | 31,521 | 100% | 46.78 | ▲6.8% |
| FY2020 | 39,146 | 2,504 | 36,642 | 100% | 45.30 | ▲9.7% |
| FY2021 | 42,172 | 2,613 | 39,559 | 100% | 38.49 | ▲23.3% |
| FY2022 | 52,716 | 2,790 | 49,926 | 100% | 37.95 | ▲24.4% |
| FY2023 | 57,791 | 3,097 | 54,694 | 100% | 37.81 | ▲24.7% |
| FY2024 | 55,156 | 2,947 | 52,209 | 100% | 35.63 | ▲28.8% |
| FY2025 | 59,717 | 2,852 | 56,865 | 100% | 38.06 | ▲24.2% |
(Note 1)Numerator: Total floor area (m2) of properties for which data for the current year are identified. Denominator: Total portfolio floor area for the current fiscal year
(Note 2)Intensity = [Each consumption] / [Total gross floor area for each FY], adjusted for occupancy rate.
(Note 3)From FY2025, the data aggregation period is from March 1 to the end of February of the following year. Up to FY2024, it was from April 1 to the end of March of the following year.
Reduce GHG emissions (Scope 1 and 2) by 42% by FY2030 (FY2021 baseline)SBTi
Aim to achieve net zero GHG emissions across the entire value chain by FY2050SBTi
This table can be scrolled sideways.
(unit: t-CO2)
| GHG | Scope1 | Scope2 (Market-based) (Note 1) |
Scope1+2 | Percentage Change | Scope3(Note2) | Scope1+2+3 | Data coverage (Floor area basis) |
||||
|---|---|---|---|---|---|---|---|---|---|---|---|
| Category1 | Category2 | Category3 | Category5 | Category13 | |||||||
| FY2021 | 0 | 939 | 939 | - | 2,541 | 1,025 | 734 | 390 | 8,558 | 14,187 | 100% |
| FY2022 | 0 | 860 | 860 | ▲8.4% | 3,060 | 890 | 229 | 398 | 13,340 | 18,777 | 100% |
| FY2023 | 1 | 0 | 1 | ▲99.9% | 3,639 | 2,301 | 164 | 633 | 13,895 | 20,633 | 100% |
| FY2024 | 0 | 0 | 0 | ▲99.9% | 3,926 | 1,063 | 231 | 544 | 13,712 | 19,476 | 100% |
| FY2025 | 1 | 0 | 1 | ▲99.9% | 3,389 | 1,952 | 229 | 447 | 15,616 | 21,634 | 100% |
(Note 1)Scope 2 (Market-based method) is calculated considering co-ownership. MEL purchased non-fossil fuel certificates equivalent to our entire Scope 2 emissions from FY2023, achieving a 100% offset of our Scope 2 emissions.
(Note 2)Emissions from the tenant-management portion are accounted for in Scope3 based on the owners/tenants' control authority. In addition, Scope of the same property may differ from year to year depending on the status of acquiring the data.
(Note 3)Aggregation by category has been conducted since FY2023. Please refer to the data disclosed under Green Finance for prior fiscal years.
(Note 4)From FY2025, the data aggregation period is from March 1 to the end of February of the following year. Up to FY2024, it was from April 1 to the end of March of the following year.
This table can be scrolled sideways.
No increase in water consumption intensity by FY2030 (FY2017 baseline)
| Water Consumption | Water consumption (m3) | Data coverage (GFA basis)(Note 1) |
Water consumption intensity (m3/m2) (Note 2) |
Percentage Change |
|---|---|---|---|---|
| FY2017 | 63,255 | 100% | 0.114 | - |
| FY2018 | 70,833 | 100% | 0.127 | 11.9% |
| FY2019 | 73,839 | 100% | 0.103 | ▲9.8% |
| FY2020 | 80,550 | 100% | 0.092 | ▲18.9% |
| FY2021 | 84,855 | 100% | 0.082 | ▲27.6% |
| FY2022 | 110,410 | 100% | 0.078 | ▲31.4% |
| FY2023 | 128,747 | 100% | 0.084 | ▲25.9% |
| FY2024 | 128,306 | 100% | 0.083 | ▲27.0% |
| FY2025 | 124,903 | 100% | 0.079 | ▲30.5% |
(Note 1)Numerator: Total floor area (m2) of properties for which data for the current year are identified. Denominator: Total portfolio floor area for the current fiscal year
(Note 2)Intensity = [Each consumption] / [Total gross floor area for each FY], adjusted for occupancy rate.
(Note 3)From FY2025, the data aggregation period is from March 1 to the end of February of the following year. Up to FY2024, it was from April 1 to the end of March of the following year.
This table can be scrolled sideways.
Achieve a waste recycling rate of 70% or higher by FY2030
| Waste Management | Total waste generated (t) | Data coverage (Floor area basis) (Note 1) |
Recycling rate |
|---|---|---|---|
| FY2017 | 1,202 | 82.5% | 54.9% |
| FY2018 | 1,624 | 87.9% | 73.3% |
| FY2019 | 1,700 | 93.6% | 66.6% |
| FY2020 | 1,867 | 86.7% | 63.4% |
| FY2021 | 3,939 | 90.6% | 62.3% |
| FY2022 | 4,802 | 79.1% | 70.2% |
| FY2023 | 4,849 | 86.4% | 64.8% |
| FY2024 | 4,540 | 90.0% | 65.6% |
| FY2025 | 4,704 | 92.0% | 59.7% |
(Note 1)Numerator: Total floor area (m2) of properties for which data for the current year are identified. Denominator: Total portfolio floor area for the current fiscal year
(Note 2) From FY2025, the data aggregation period is from March 1 to the end of February of the following year. Up to FY2024, it was from April 1 to the end of March of the following year.
This table can be scrolled sideways.
| Solar Power Generation | Annual power generation (Kwh) (Note 1) |
|---|---|
| FY2018 | 7,017,147 |
| FY2019 | 6,710,582 |
| FY2020 | 11,432,928 |
| FY2021 | 14,311,834 |
| FY2022 | 14,709,934 |
| FY2023 | 18,124,693 |
| FY2024 | 19,465,251 |
| FY2025 | 19,769,509 |
(Note 1) Most renewable energy generated is sold externally. Figures for co-owned properties are reported on a 100% basis. Solar power generation data is limited to properties and periods where data is available.
(Note 2) From FY2025, the data aggregation period is from March 1 to the end of February of the following year. Up to FY2024, it was from April 1 to the end of March of the following year.
Some data that is the basis of the above table "Environment-related data" is subject to limited guarantee by a third-party organization (Japan Environmental Certification Organization). Please refer to the following third party warranty report for details.
※Greenhouse Gas Emissions Independent Verification Report
※Environmental Performance Data Independent Verification Report